Profiling jobs with DCRAB tool
DCRAB is a tool to monitorize resource utilization in HPC environments. It works side-by-side with the job scheduler to collect runtime information about the processes generated in the compute nodes.
Excluding a few cases, data collected by DCRAB is collected from the processes the job has started, not from the entire node. The tool is able to collect the information listed below:
- CPU used
- Memory usage
- Infiniband statistics (of the entire node)
- Processes IO statistics
- NFS usage (of the entire node)
- Disk IO statistics
All the information is readily available from the moment the job is submitted, that is, you can obtain the information and visualize the data in runtime.
You can find additional information in the following links:
How to submit jobs
To use DCRAB you only need to add some additional information into your batch script:
$ module load DCRAB/2.0
dcrab start

##################################
#    BLOCK OF CODE TO MONITOR    #
##################################

dcrab finish
#!/bin/bash
#PBS -q parallel
#PBS -l nodes=2:ppn=24
#PBS -l mem=100gb
#PBS -l cput=1000:00:00
#PBS -N AUSURF112

cd $PBS_O_WORKDIR

module load QuantumESPRESSO/6.2.1-intel-2017b
module load DCRAB

dcrab start

mpirun -np $NPROCS pw.x < ausurf.in >& OUTPUT_FILE

dcrab finish
DCRAB will start a process in each compute node where the job is being executed and will monitorize the processes. DCRAB will generate a directory report called dcrab_report_jobid where jobid is the job number assigned by the scheduler. This reporting directory is generated in the same folder where the job was submitted from. Inside this reporting directory, DCRAB will create the reporting file called dcrab_report.html. Generating this file is the main purpose of DCRAB and within you will find statistics and plots to visually analyze the information collected. This report is continuously updated (every 10 seconds by default). The report can be opened with a browser and since it is completely modular you can move or copy it around.
Inside the dcrab_report_jobid folder you will find some subdirectories. These are not relevant at all for the user because they are generated to guarantee the correct behavior of the tool. One will be data, which contains for each computing node the files in charge of the management of the processes associated with the job. Another folder called auxFile stores the files used for the communication between compute nodes, and log, which contains the output generated by DCRAB process in each node and DCRAB’s main process output (all used for troubleshooting).
Data visualization
Below you can find some examples of the charts the tool will generate for the report.
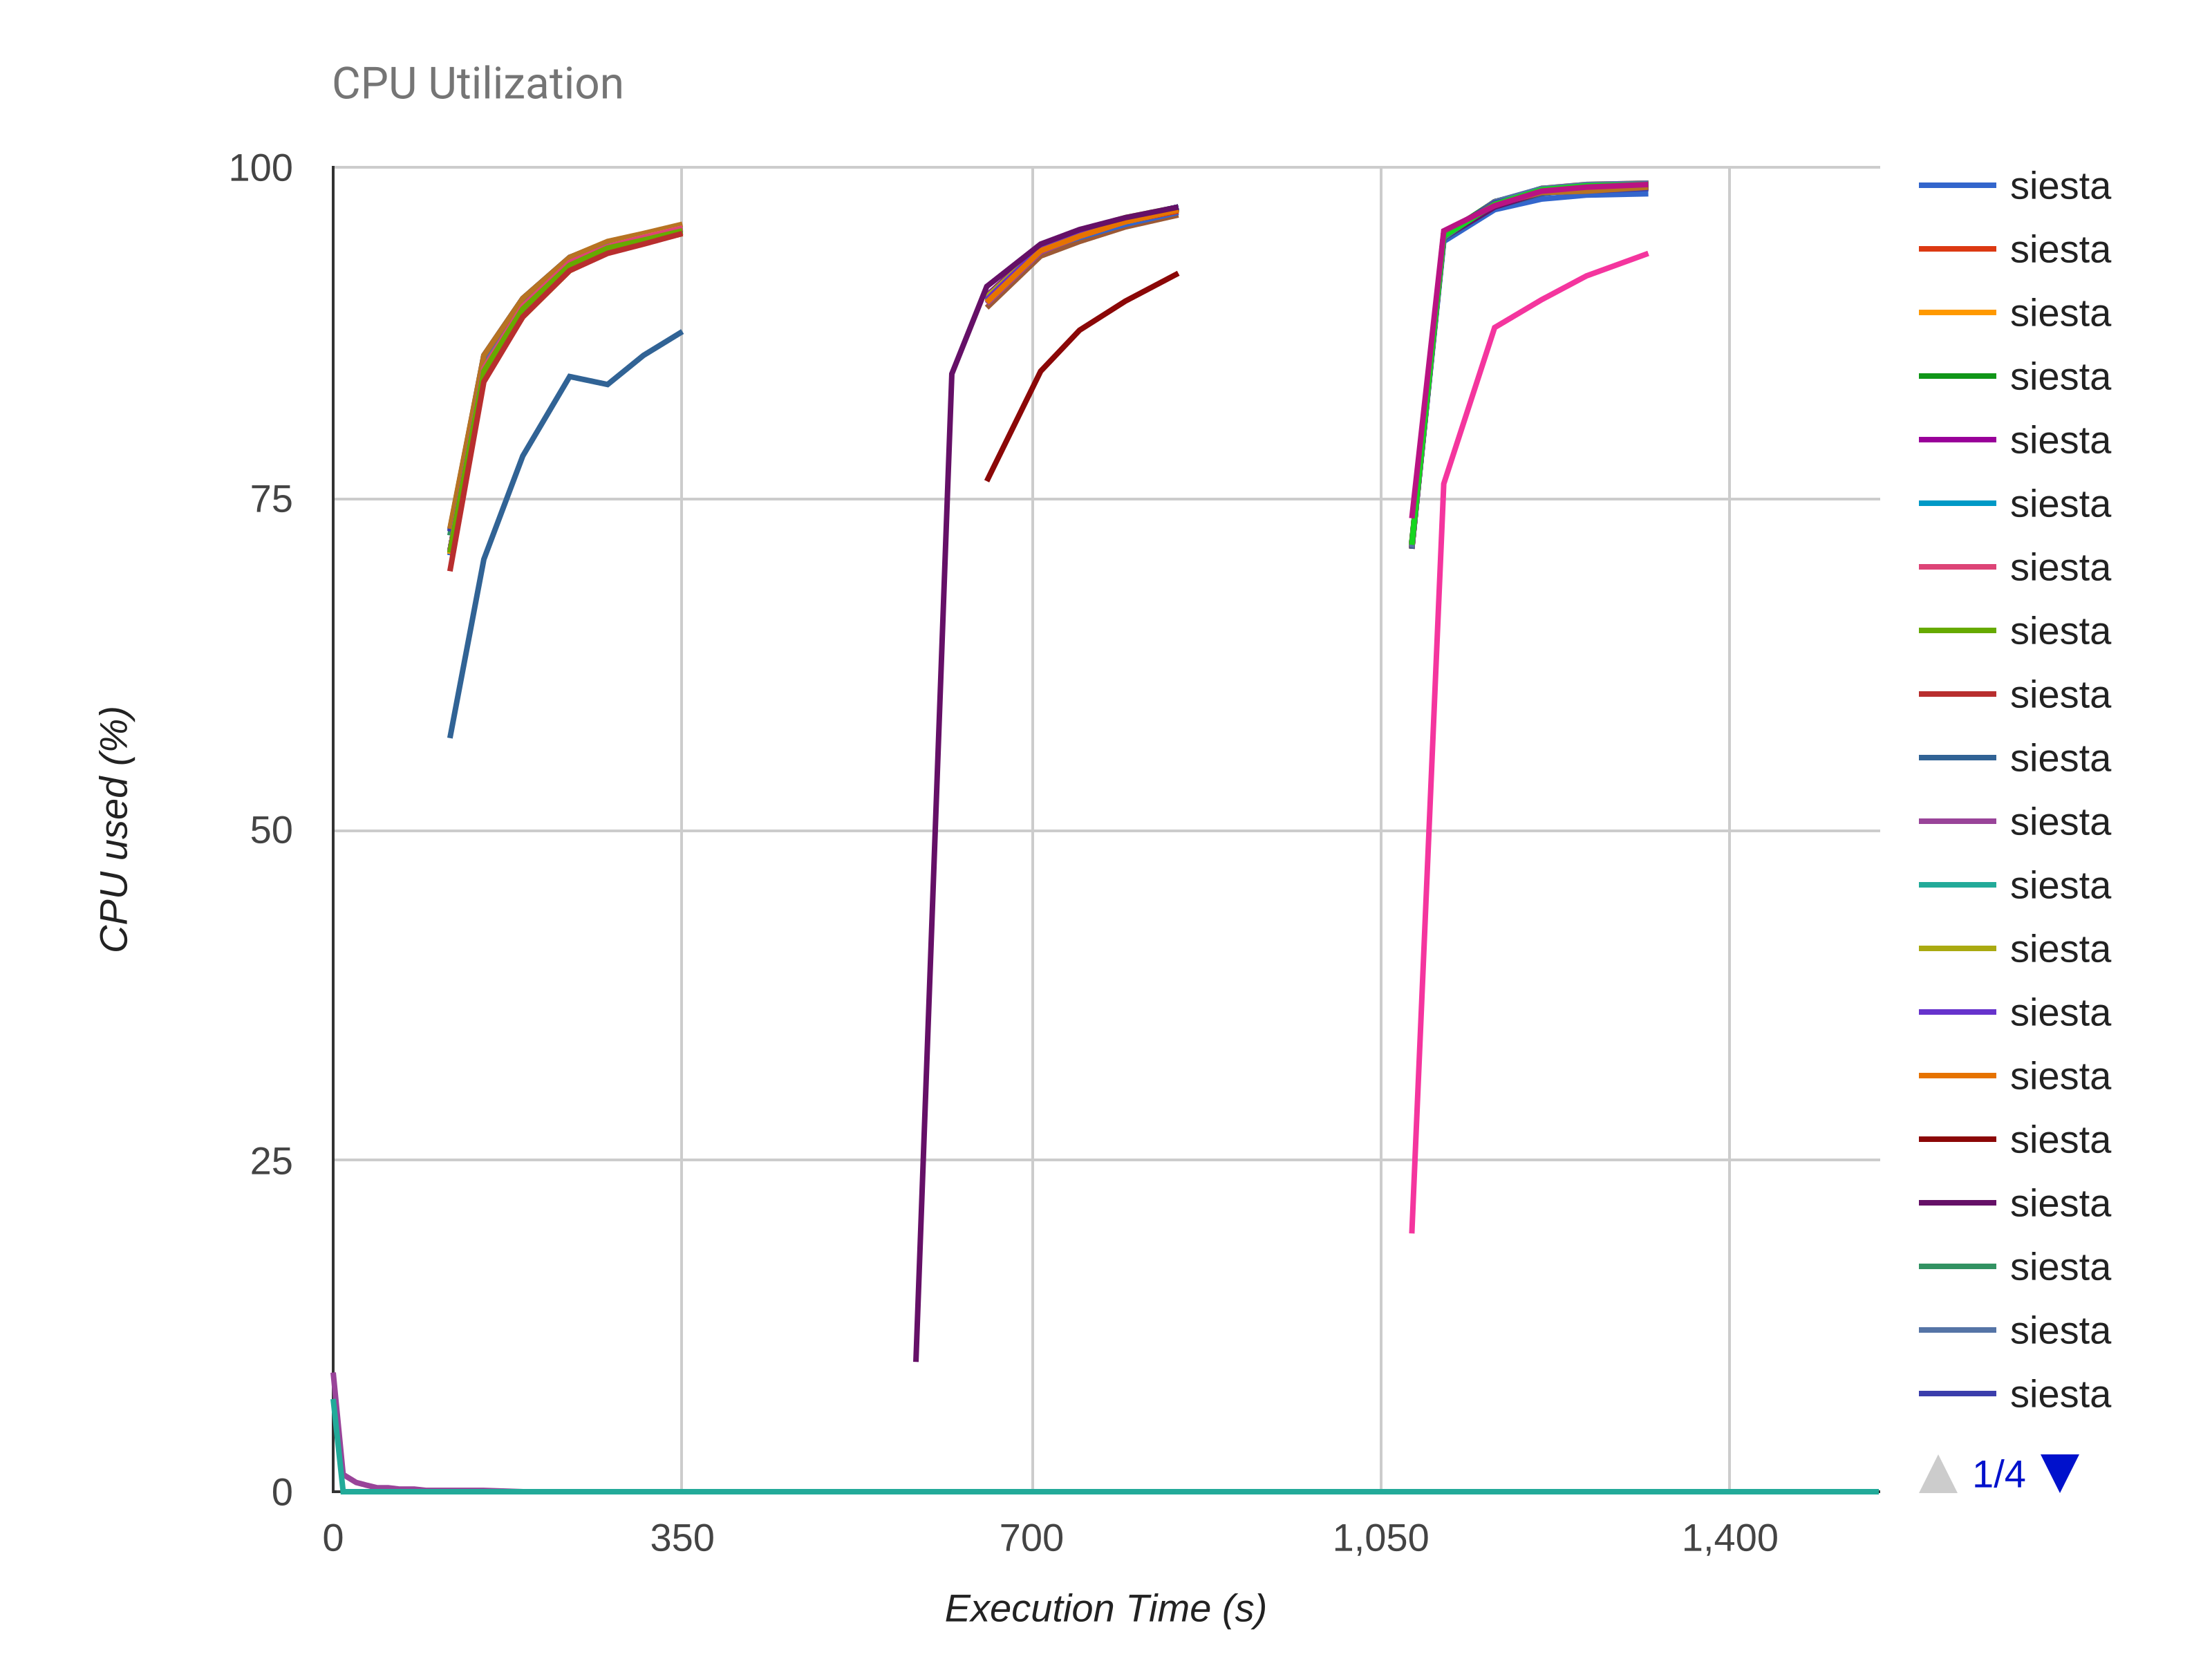 | 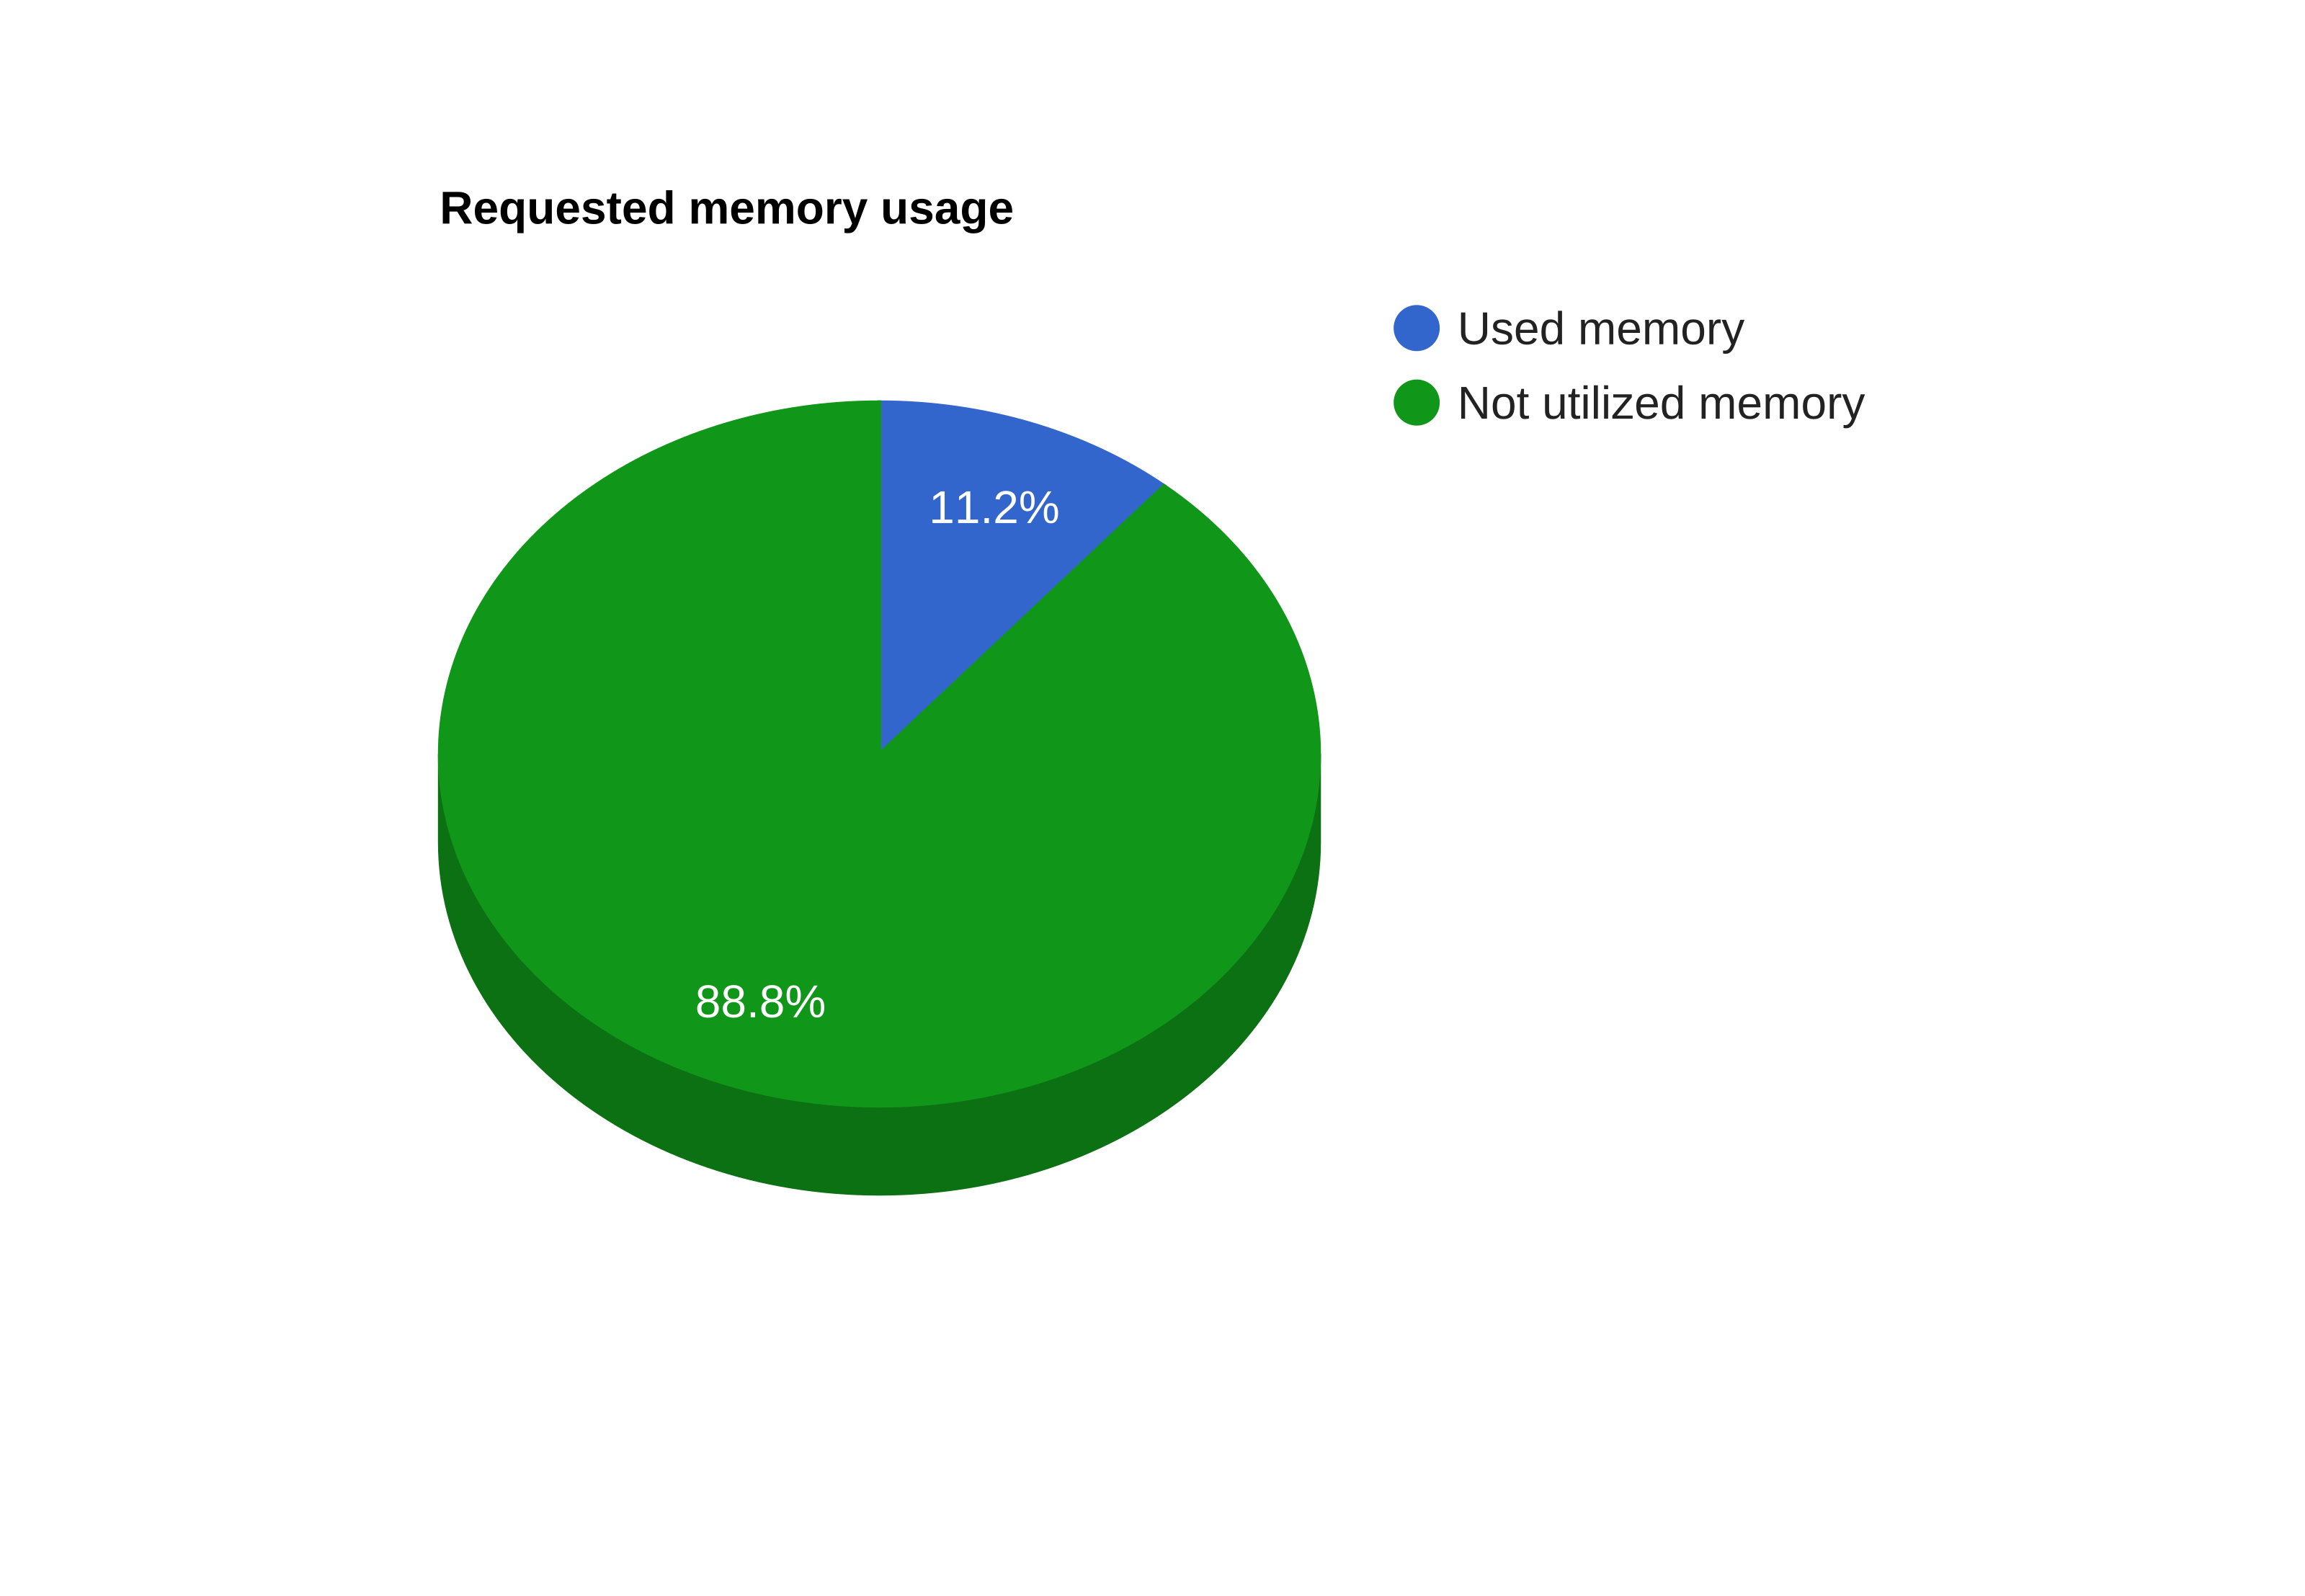 |
| CPU usage | Memory usage |
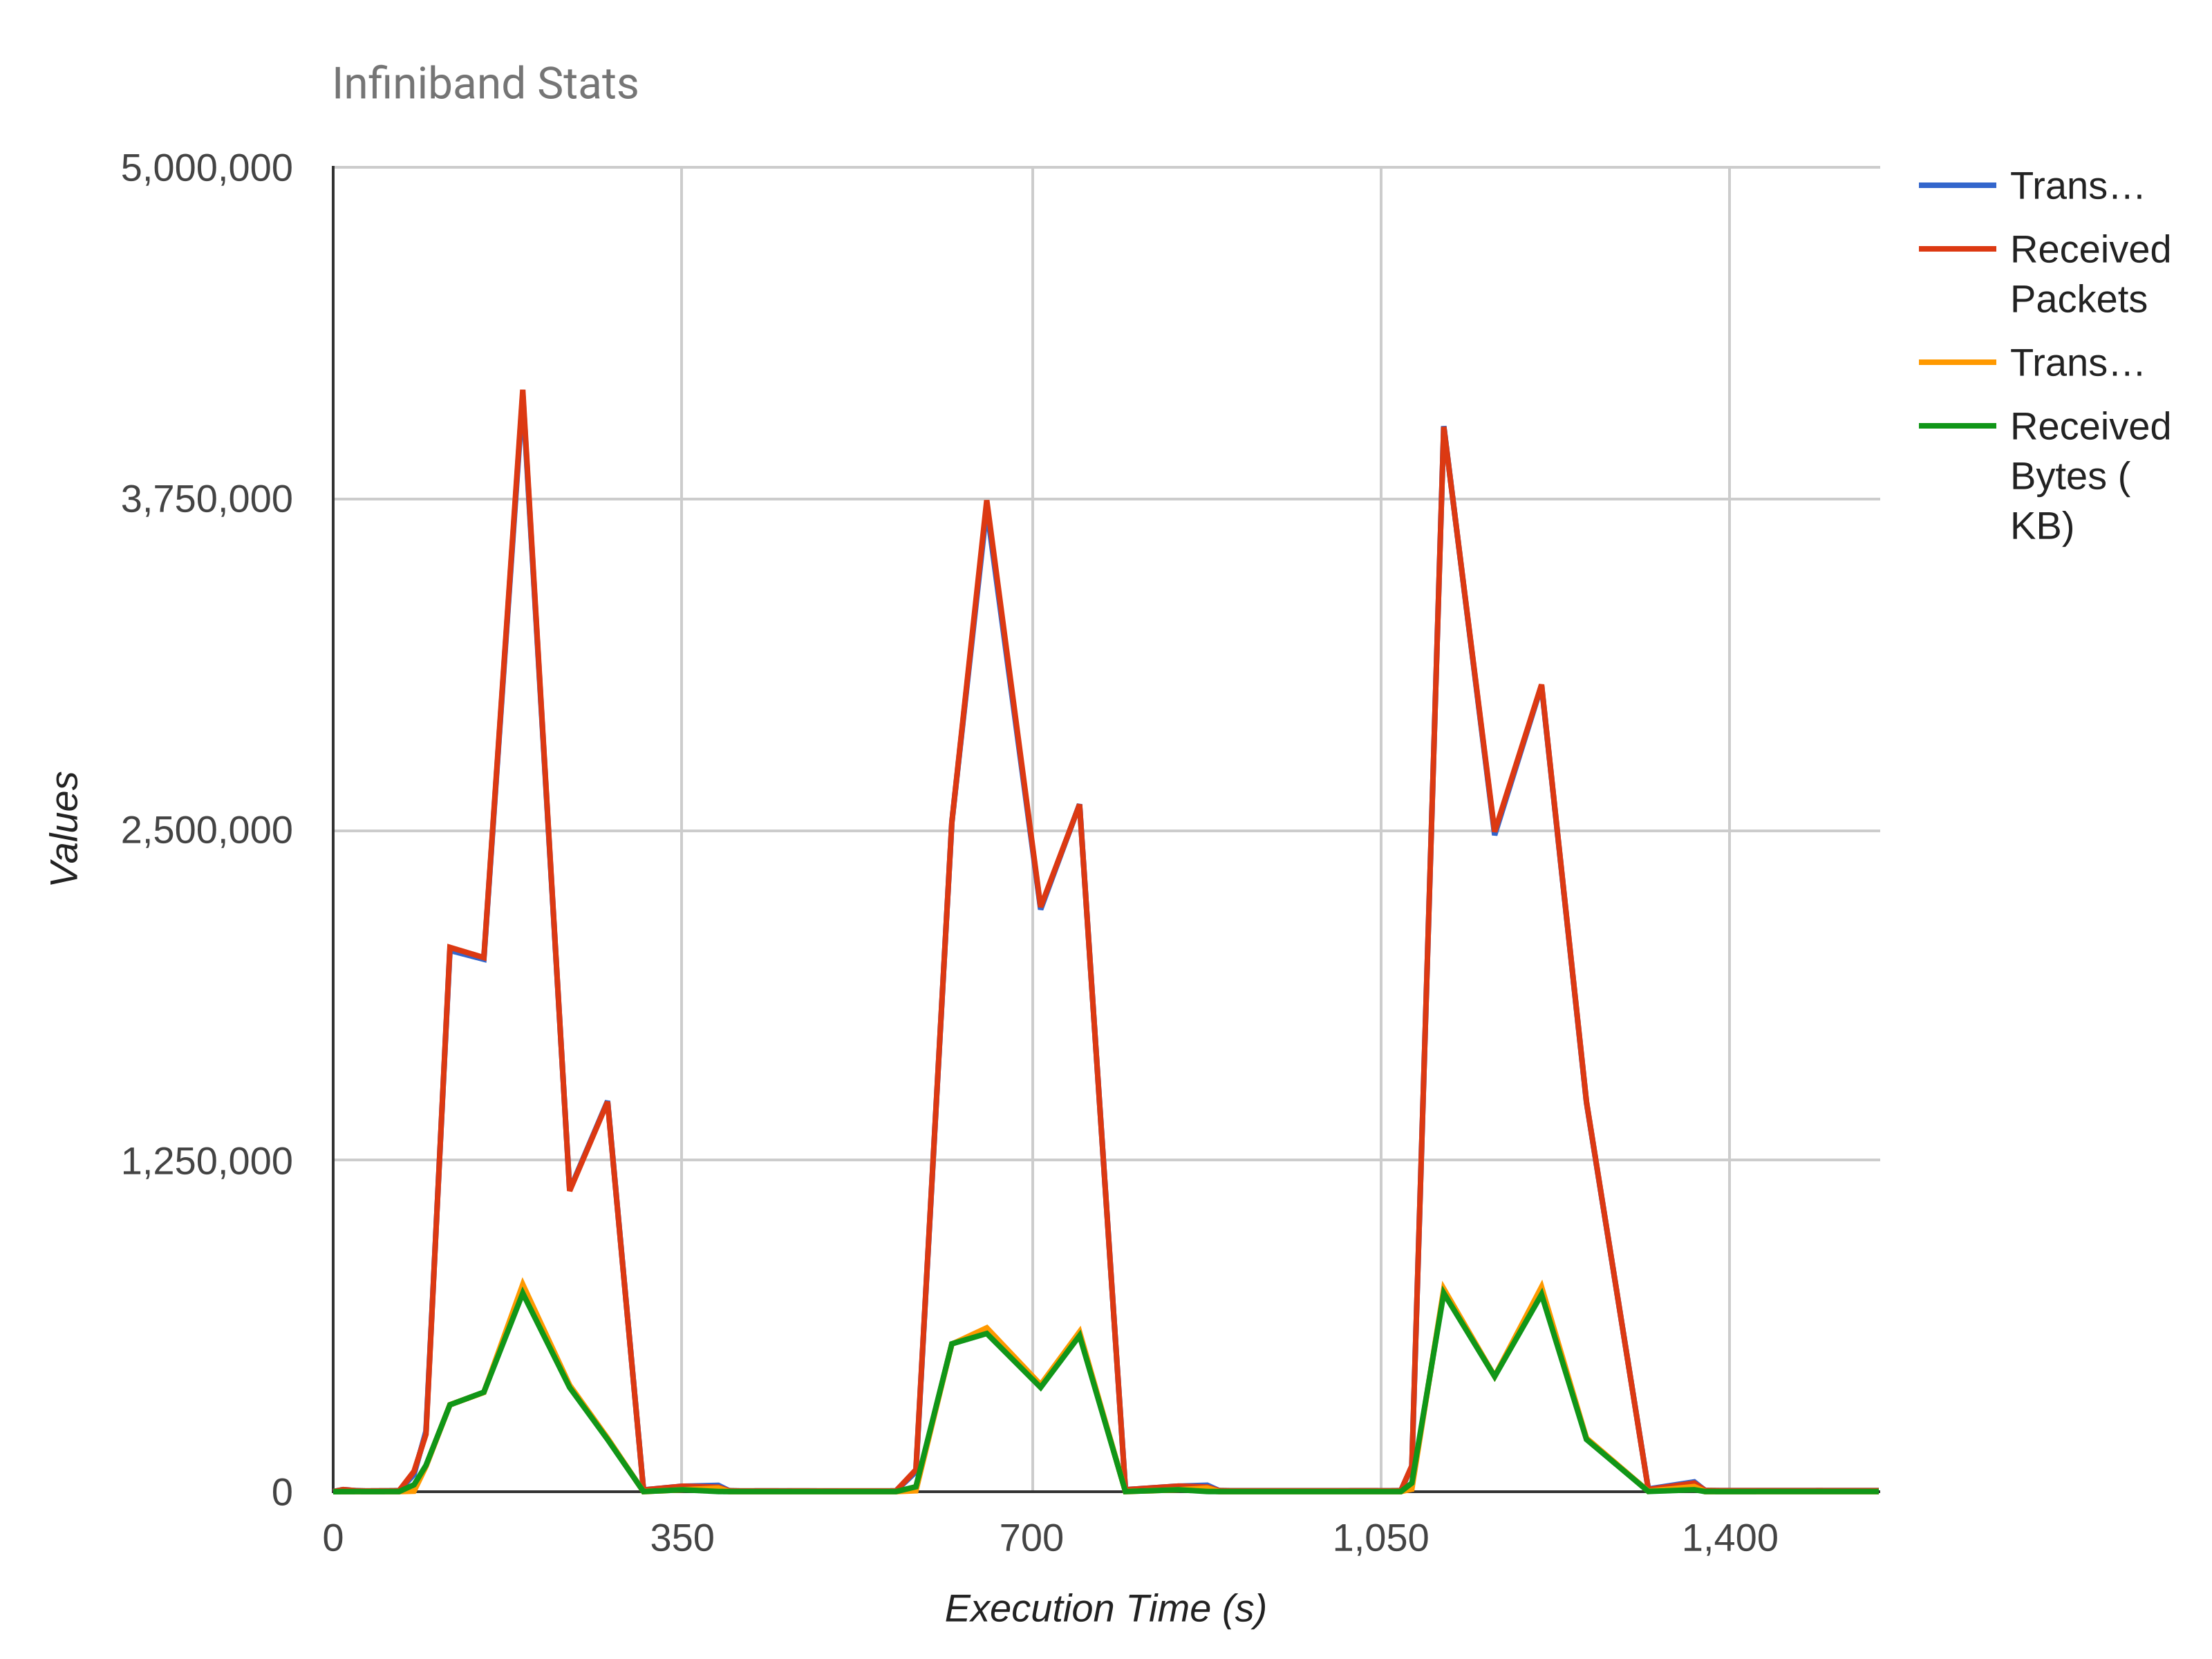 | 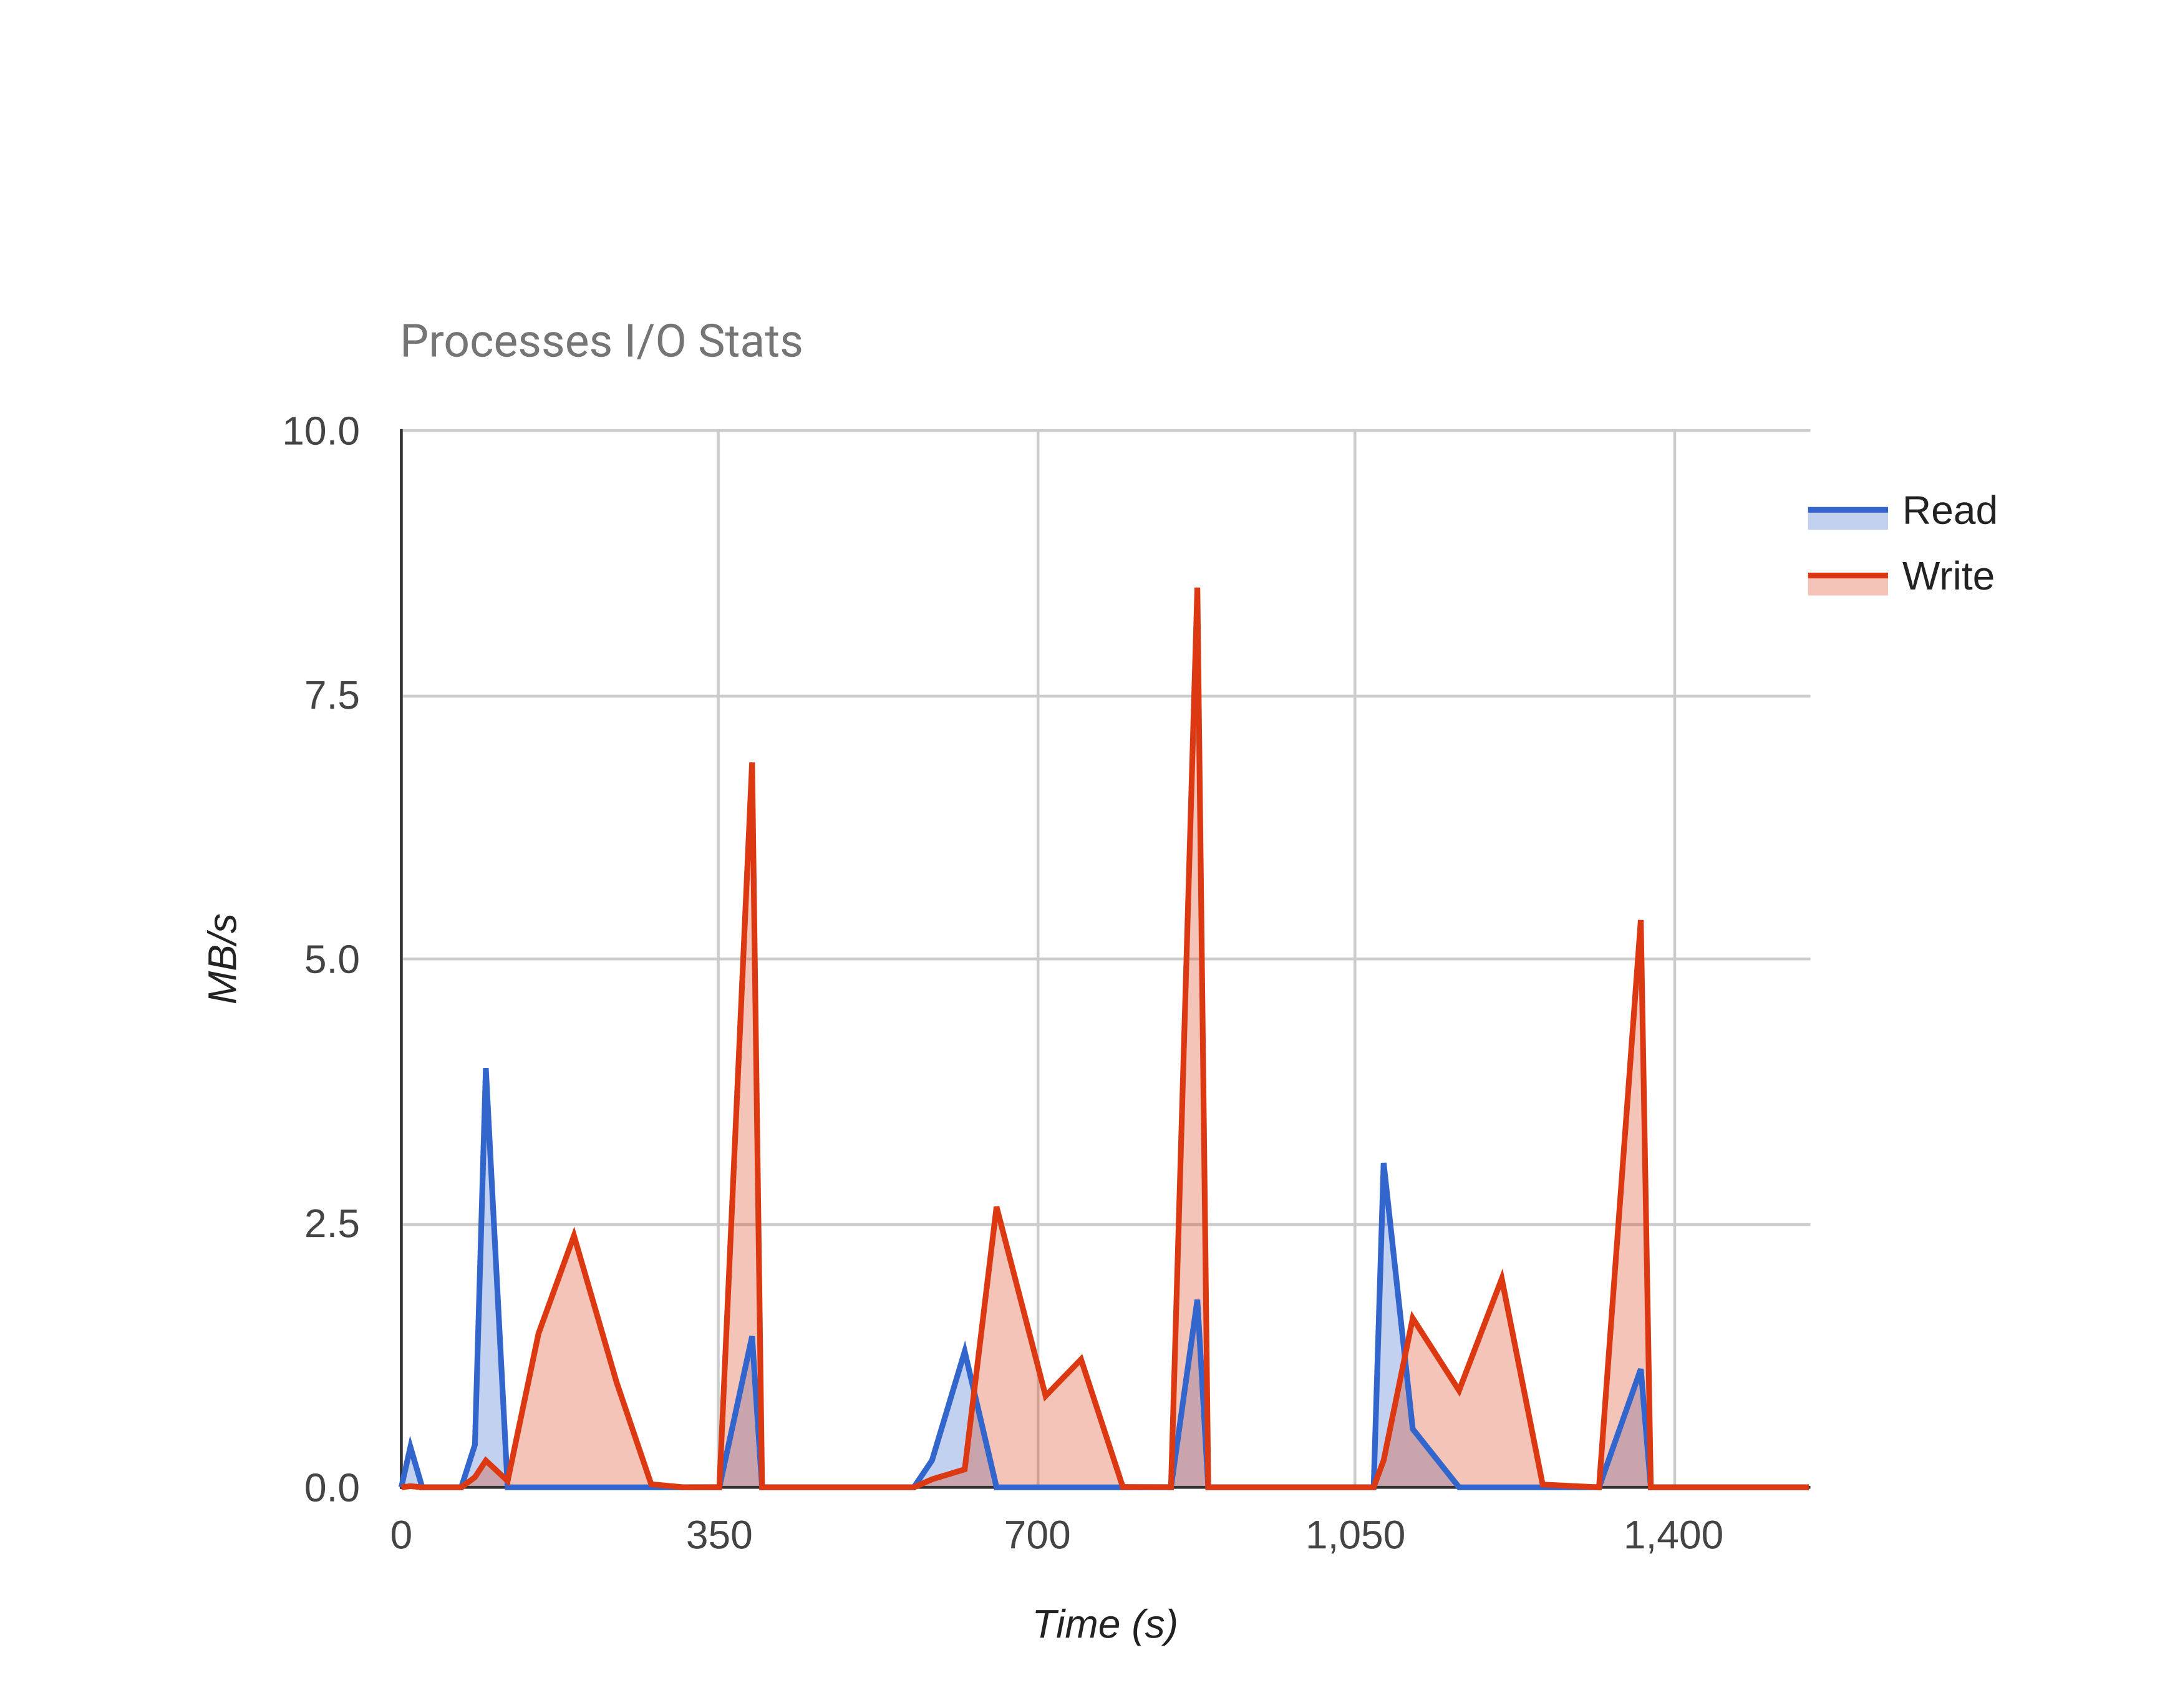 |
| Infiniband network usage by the node | I/O against the filesystems |
Here you can see how the reports look like when opening it with a internet browser: